Monday, April 16, 2012

Experiment 12: CD Diffraction

Experiment 12: CD Diffraction

Introduction:
The purpose if this experiment it to determine the distance between the grooves on the CD. The groove spacing obtained will be compared to the manufacturer's standard value, 1600nm.

Procedure:
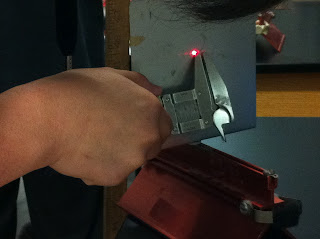
First, we first set up the experiment with a lhelium neon laser perpendicularly to the surface of the disk. As the laser hit the surface of the CD, the laser beam diffract and split into multiple beams of light. Both the CD and the laser should be adjusted until the the zero order maximum would shown on the board. Then record the the perpendicular distance between the board and the disc and the distance between the maximums.


Data and Analysis
tan(θ) = x/L
d=mλ/sin(θ)


 λ (nm)
X (cm)
L(cm)
θ(rad)
d(nm)
% error
Trial #1
633
17.8 ± 0.1
35.5 ± 0.1
26.6°
1413.7
- 11.5
Trial #2
633
13.2 ± 0.1
32.1 ± 0.1
22.4°
1661.1
4.4
Trial #3
633
24.8 ± 0.1
51.5 ± 0.1 
25.7°
1459.0
- 8.8


Conclusion
This experiment let us have a better understanding of laser diffraction and how it can be used to measure defects in CD spacing. However, there are some errors for the data we collected in the experiment. Since we hold the screen between the laser and CD by hand, and we do not hold the screen to be perpendicular to the laser and CD, which makes the measured distance between the CD and screen L and calculated distance x not accurate. With more precise instrumentation would could significantly decrease our percent uncertainty and difference to more accurately the CD's spacing.

Thursday, April 12, 2012

Experiment 10: Lenses

Experiment 10: Lenses

Introduction:
The purpose of this experiment find the relationship between the object distance and the image distance produced by a projected image of a slit through a lens. First, we looked at the behavior of light through a magnifying glass which is a double convex lens. We used a light box which illuminated a pattern on a piece of paper, and placed the magnifying glass at specific distances away from the light box, and had a blank sheet on which to project the image.


Object distance
as a multiple
of f (cm)
Object distance(cm)
Image distance(cm)
Object height(cm)
Image height(cm)
M
5f
77.5 ±0.5
28.70 ±0.5
8.50 ±0.2
3. 0 ±0.5
0.35
4f
62.0.0 ±1.00
28.5 ±0.5
4.20 ±0.2
0.494
3f
46.5 ±0. 5
34 ±0.5
6.40 ±0.5
0.75
2f
31.0 ±0.20
51.70 ±0.2
14.50 ±1
1.71
1.5f
23.0 ±0.5
96 ±2
38.2 ±2
4.49


Conclusion:
We observed that the image is always inverted, along both the vertical and horizontal axis, if this was a single convex mirror then the image would not have have been inverted. The slope of the negative inverse d_0 to the negative inverse d_i is about 0.5. This would be the degree M that the image is changing. like we observed if the object was getting further away then the image would become smaller and smaller till it becomes to small to measure.

Relationship between wavelength and frequency


Relationship between wavelength and frequency:

Introduction:
The purpose of this experiment is to determine the relationship between frequency and wavelength by measuring the number of waves to pass through a spring. In this experiment, we will use a long spring with a length of 1.2m. We will wiggling the sping to creave 10 waves to and record the time.


Conclusion:
There is an inversely proportional relationship between wavelength and frequency. When frequency is decreasing; wavelength has increased. The source of error contributed in this experiment can be the inaccurate measurement of the length of spring, and the time needed for 10 waves to pass through the point.

Monday, April 9, 2012

Experiment 11: Measuring a huaman hair

Experiment 11: Measuring a  huaman hair
Introduction:
The purpose of this experiment is to accurately measure the thickness of a human hair by using laser or light interference. First, we taped a human hair on to a 3x5 card with hold, than we pointed a laser through the hole. Finally, we used the image to be projected on to the white board, and measure the distance between the board, and the distance between the middle of the zero overtone and third.  We used equation d=λL/y to get the theoretical value in order to compare with the experimental value by using a micrometer.


Experimental Method: (micrometer)
d= 89.2 μm

Theoretical Method:
d=λL/y
  =(632.8nm) (0.935m)/(0.075m)
  = 77 μm

Conclusion:
By compare the experimental and theoretical value, the percent of error is pretty samll and these values were within the uncertainties range. By we still could find a lot of mistakes that can be made during the processes of the experiment. Such as measuring the distance between the two first order minima due to the lack of precision in equipment.


Sunday, April 8, 2012

Experiment 9: Concave and Convex Mirrors


Experiment 9: Concave and Convex Mirrors


Introduction:
In this experiment, we are to show the different effects of a convex mirror and a concave mirror. For a convex mirror, the image appears to be smaller than the object itself, it does however stays upright, and is located about the same position inside and outside the mirror. Also, when the object is moved closer to the mirror the image becomes bigger, and when it is moved further away the image gets smaller.


Part II
For concave mirrors, the image that appears in the mirror is larger, but it is inverted, and relative to the position of the mirror the object well seem closer. When moving the object closer to the mirror makes the image smaller, and upright and as for moving further away the image grows to infinite


Conclusion:
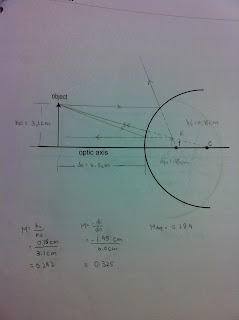
In this experiment we can clearly see how convex and concave mirrors would work on an object being placed in front of them. We also identified how we can see the image in the mirror by drawing lines to where the focal point, the lens of the mirror and the center of the sphere.  


Thursday, April 5, 2012

Marshmallows Lab Quiz

Marshmallows Lab Quiz
Introduction:
The purpose of this experiment is to study the electromagnetic waves by microwave marshmallows and water. We microwaved some marshmallows for approximately 11s. The standing wave on the marshmallows is about 12cm±1cm long from antinode to antinode. Then we microwaved a cup of 100g of water at temperature of 20oC for 10s.  The temperature of the cup of water increases from 20 oC to 57 oC. The measurment of the microwave is 35cm x 35cm x 23cm. Based on these information, we have to determine the frequency, the dimensions of the waves, the total energy content of the cavity, the number of photons per second oscillating in the microwave, and the pressure these photons exert on the side of the microwave.


Questions:
1.  f = v/λ
       = (3*10^8) /0.12
       = 2.5 *10 ^9 HZ
2. The smallest dimensions of the microwave must be 24 cm x 24 cm x 12 cm. This is assuming that the wave travels along the diagonal of the microwave where the diagonal is 12 cm.
3.  Q = mc (T)
         = (0.1) (4.184)* (57 oC - 20 oC )
         = 15481 J 

4. E = (hc)/λ
       = (6.626*10^-34)(3*10^8)/ 0.24
       = 8.28 *10^25 J/photons
    Photons/Time = Q/E
                            = 15481 / (8.28*10^-25)
                            = 6.23 * 10^26 photons/s
5. P = Q/T
       = 15481J/ 30s
       = 515.5 W
    
    p = P/Ac
       = 515.5/((0.35*0.35)*(3*10^8))
       = 2.13 *10^-5 N/m

Experiment 5: Introduction of Sound

Experiment 5: Introduction to Sound

Introudction:
The purpose of this experiment is to learn the properties of sound waves by using LabPro and microphone to make recordings of "AAAA" sound. We will obtain sound wave graphs and analyze the graphs to understand the properties of sound waves.

1 "AAA" Sound
a. Yes, this is a periodic wave. From the graph, we can see the wave has repeating pattern.

b. About 2 waves are shown in the sample. One complete wave is from one high peak to the second high peak. In the graph there are three peaks, so there are two waves.

c. The probe collected data as fast as the frames separated on TV.

d. The period of these waves should be 0.01s/wave.

e. The frequency should be 1/T=1/0.01=100Hz

f. lambda=v/f=360/100=3.6m. This can be the length of a table in the classroom.

g. w=2pi*f=2*3.14*100=628rad/s
     A=v/w=360/628=0.571m

h. The number of waves would change and be increased. The time it takes to collect the data will increase too. Period, frequency, wavelength, and amplitude wont  change.

 2. The period is much shorter than the previous more.